A aparut WordStat 2024!
Recent s-a lansat WordStat 2024 care face un pas semnificativ înainte în aplicarea dezambiguizării sensului cuvântului la modelele de topică.
Descrierea din pagina producatorului:
What’s New in Version 2024?
We’re delighted to announce the release of WordStat 2024. This new version includes important speed optimizations as well as several useful features for exploring in greater detail and in a more focused way large text collections. Here are some new and improved features:
1. Optimized Initial Text Processing
In Version 2024, WordStat has significantly enhanced the efficiency of the initial reading and processing of data files, resulting in expedited results. This improvement is particularly pronounced for projects comprising a large number of small documents, with the first operation now completing up to three times faster than in previous versions.
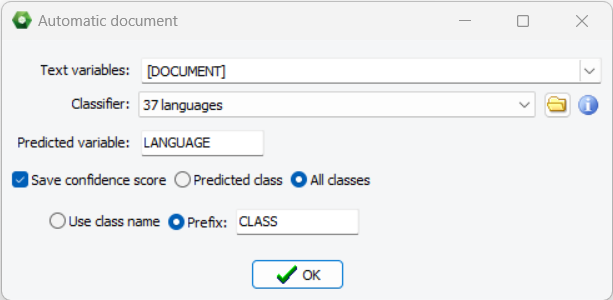
2. Apply Automatic Document Classification Models to Project Data
WordStat 2024 now allows the application of automatic document classification models for data transformation. Found on the Data page, this new feature facilitates the storage of predicted classes in a variable. Users can also opt to store the probability of the predicted class or probabilities of all classes.
3. Improved Language Detection
WordStat 2024 introduces a new language identification classification model that can identify 37 languages accurately (most languages using Latin, Arabic or Cyrillic characters). It’s measured accuracy is above 98% on very small text segments (five words or less) and above 99.5% on longer documents. The classification model may be applied to create a language variable in a multilingual project, allowing one to filter and analyze different languages separately.
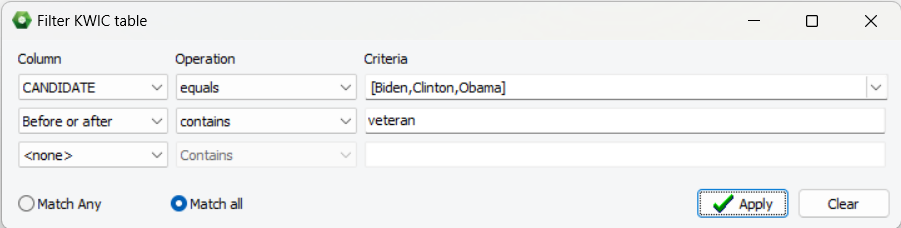
4. Filter KWIC tables on up to three criteria
A new filter option on the Keyword-in-Context page may now be used to filter the results of the KWIC table on any selected independent variables or on words or phrases appearing before or after the key item.
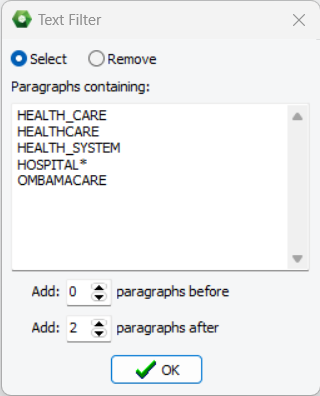
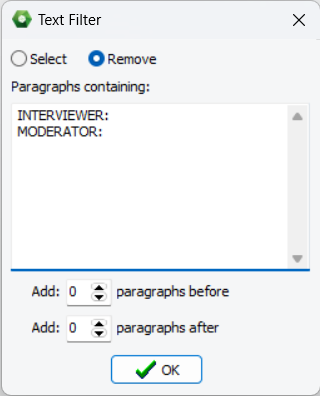
5. Select or Exclude Paragraphs using Text Filters
An advanced preprocessing feature enabled users to filter in or out paragraphs containing specific words or phrases. Multiple items can be specified and may be preceded or ended with an asterisk to represent zero, one, or several additional characters. One may also select specific numbers of paragraphs before or after the matching paragraph in order to include or exclude the surrounding context. This feature is especially useful to quickly focus the text analysis on specific topics in large datasets without the need to create a new dataset. When analyzing interview or focus group transcripts, it may also be used to remove interviewer’s questions or the moderator’s interventions if their interventions are clearly indicated by specific key strings.
6. Save Text Retrieval Results to a New Project File
When using the keyword retrieval function, a new button now allows one to save the obtained table as a new project file. This includes preserving options from the current project, such as pre- and post-processing settings, and the link to the categorization model. This feature proves especially handy for in-depth analysis of text segments on a specific topic or meeting specific conditions.
7. Copy Graphics’ Data to the Clipboard in Text Format
It is now possible to save data utilized for creating various graphics to the clipboard in tab-delimited format. One may then seamlessly paste the data in another application to generate tables or custom charts.
8. More Ways to Add Items to the Categorization Dictionary
Right clicking on items of a 2D correspondence plot or of a deviation table now allows one to add those items to an existing or a new category. This option is disabled or hidden when the selected item is already present in the current categorization model or refers to a content category.
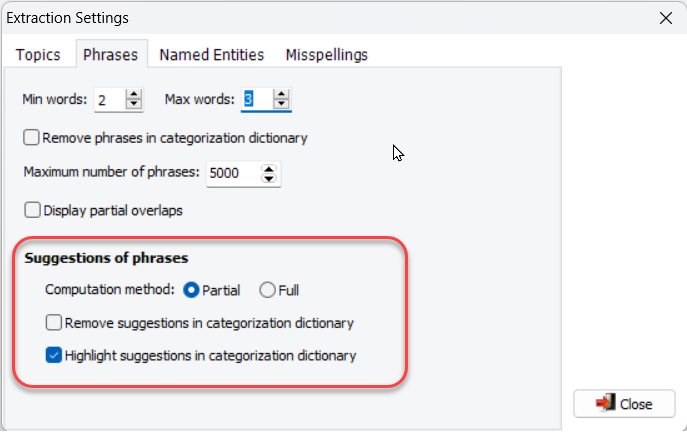
9. Filtering and Highlighting of Suggested Phrases.
New phrase extraction options have been added to remove or highlight (bold + italic) phrases already in the current categorization dictionary. Additionally, a filtering mechanism has been introduced, allowing users to set a minimum frequency to narrow down suggested phrases.
Va stam la dispozitie cu cotatii de pret prompte si avatajoase!
ORDSTAT – SOFTWARE PENTRU ANALIZA TEXT
WordStat is a flexible and easy-to-use text analysis software – whether you need text mining tools for fast extraction of themes and trends, or careful and precise measurement with state-of-the-art quantitative content analysis tools. WordStat‘s seamless integration with SimStat – our statistical data analysis tool – QDA Miner – our qualitative data analysis software – and Stata – the comprensive statistical software from StataCorp, gives you unprecedented flexibility for analyzing text and relating its content to structured information, including numerical and categorical data.
What it is used for?
WordStat can be used by anyone who needs to quickly extract and analyze information from large amounts of documents. Our content analysis and text mining software is used for:
- Content analysis of open-ended responses, interview or focus group transcripts
- Business intelligence and competitive web sites analysis
- Information extraction and knowledge discovery from incident reports, customer complaints
- Content analysis of news coverage or scientific literature
- Automatic tagging and classification of documents
- Fraud detection, authorship attribution, patent analysis
- Taxonomy development and validation
WORDSTAT FOR STATA – ANALIZA DE CONTINUT SI TEXT MINING PENTRU STATA
Stata is a complete, integrated statistical software package created by StataCorp LP (www.stata.com). It provides a wide range of statistical analysis, data management, and graphics. Released in June 2013, version 13 added many new features, including a long string data type allowing one to store along with numerical and categorical data, documents up to 2 billion characters. One could thus create a statistical database with journal abstracts, news transcripts, patents, incident reports, customer feedbacks, interviews and so on.
WordStat for Stata was created to allow Stata users running under Windows, to apply text analytics techniques on any string variables stored in a Stata data file. WordStat combines natural language processing, content analysis and statistical techniques to quickly extract topics, patterns and relationships in large amount of text. It can process millions of words in seconds and compare extracted themes across any other numerical, categorical or date variables in the Stata file.
WordStat for Stata este un produs al Provalis research dedicat utilizatorilor de Stata. Toate informatiile legate de WordStat for Stata le gasiti aici.

QDA MINER – ANALIZA CALITATIVA A DATELOR
NEW in QDA Miner:
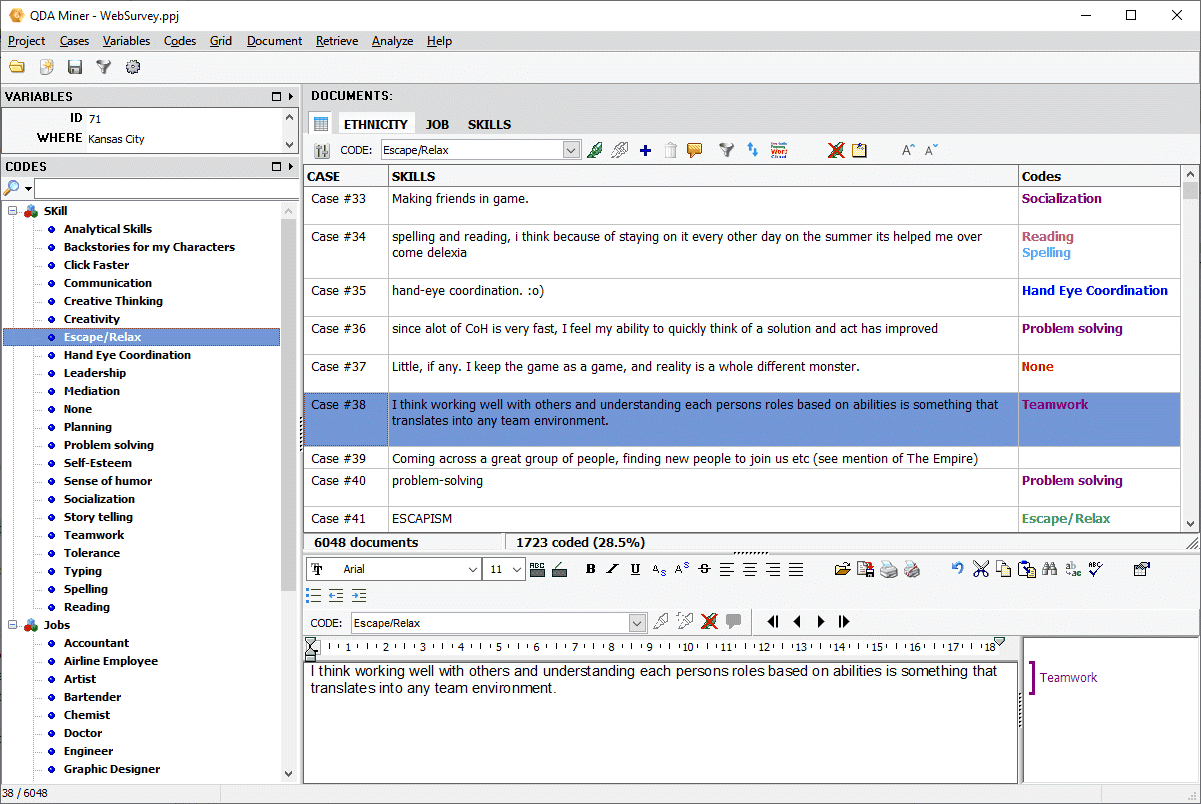
1. New Grid view mode for coding short responses
While appropriate for coding long documents, the standard document/case centric view of QDA Miner was less suited for coding short text responses such as response to open-ended questions or short comments. Now, QDA Miner 6 introduces a new grid view mode that provides a convenient and very efficient way to code this kind of text data. It is useful for everyone coding any type of open-ended comments, including surveys, employee comments, customer comments and allows one to quickly identify trends in a survey or major support issues that need to be addressed. It includes features such as:
- Drag-and-drop coding and annotation.
- Filtering of responses using text search expressions with Boolean operators
- Filtering of responses based on the number of codes (uncoded, coded, more than n codes, etc.) as well as on the presence or absence of specific codes.
- Sorting of rows either alphabetically, on text length, number of codes, or case number.
- Displays the number and percentage of coded responses,
- Computation of word clouds and word frequency analysis on text currently displayed in the grid.
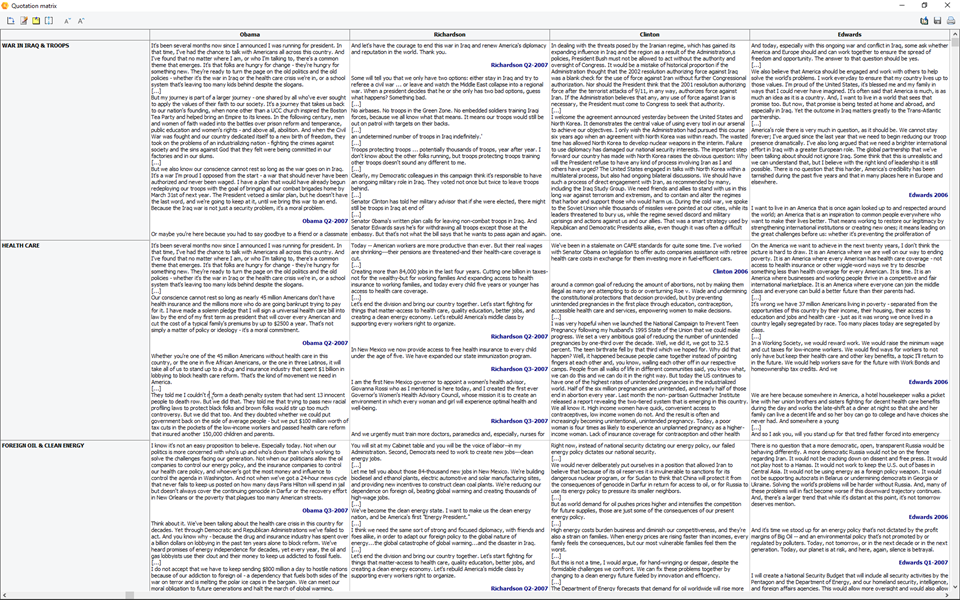
2. Quotation Matrices
The quotation matrix allows you to create a large grid containing all coded text segments and/or comments where each cell represents the intersection of a specific code with either a specific case or a value of a categorical or numerical variable (age group, gender, source, etc.). Such a joint display provides a compact view of coded material ideal for reviewing work done by coders. More easily identify patterns, creating dense summaries of results, etc. This matrix may be created from the new RETRIEVAL | QUOTATION MATRIX command to obtain a codes x cases quotation matrix or from the ANALYSIS | CODING BY VARIABLES command for displaying coded materials by all values of a variable. It supports the following features:
- Displays either all comment types or specific ones based on subject, speaker etc.
- Text in each cell can be edited in with a rich text editor (font style, size and color, paragraph formatting, etc.)
- Multiple memos can be attached to individual cells.
- Rows and columns may be transposed.
- The matrix can be exported to disk in various formats, including Excel, CSV, TSV and a new PGRD format allowing one to review and edit the table outside of QDA Miner using a free grid viewer/editor.
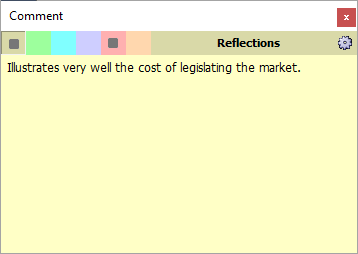
3. Enhanced annotation feature
It is now possible to attach up to six types of comments to a single code mark. Annotations may serve different purposes such as formulating hypothesis, communicating concerns with team members, summarizing, etc. You are no longer restricted to a single comment type. The removal of such limitation and the introduction of the quotation matrix feature (see above) offers new possibilities for generating condense view of summaries, concerns, hypotheses, etc. It gives you much more flexibility on how to instruct, explain codes, pose, and answer questions.
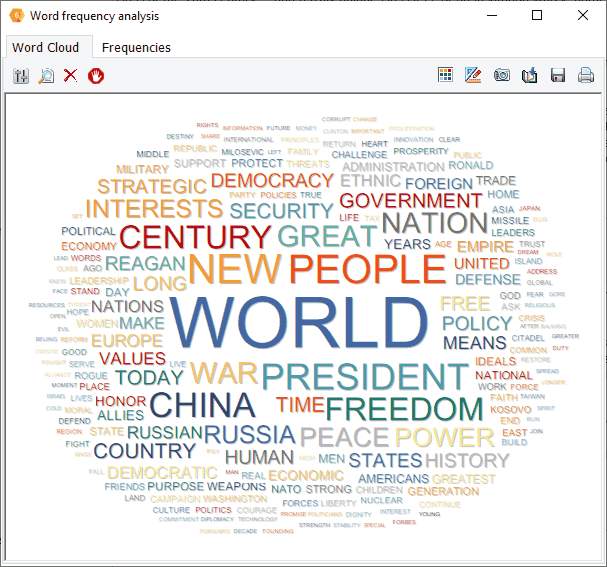
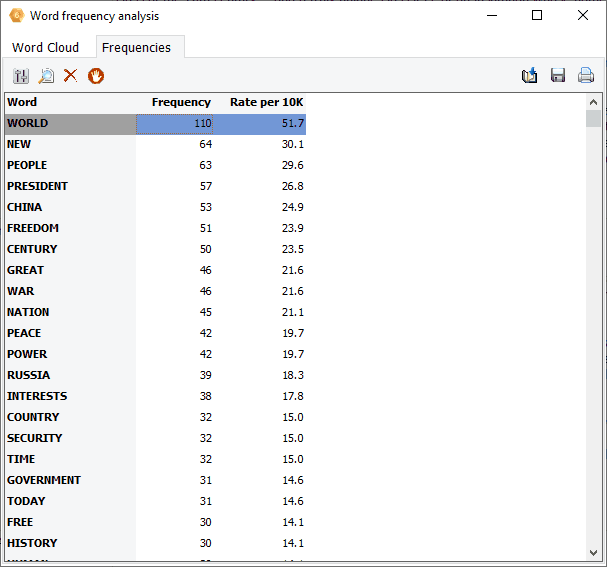
4. Word Frequency Analysis and Word Cloud
Interactive word clouds and word frequency tables can now be obtained on any document variable or on results of retrieval operations (text, coding, section or keyword retrieval) as well as for a single document or for text displayed in the new grid view. One may tailor the word cloud (font, color, shape, etc.), customize stop words lists and perform text searches from it or from the associated word frequency table.
5. Importation of Nexis UNI and Factiva Files
It is now possible to import news transcripts from the LexisNexis and Factiva output files. After selecting one or multiple .DOCX or RTF files obtained from those services, QDA Miner will extract and store in separate variables the title and body of the news transcript, its source, the publication date, and other relevant information. Such a feature should prove useful for reputation management, brand management, crisis communication, media framing analysis, comparative media studies, etc.


6. Improved Importation of Excel, CSV and TSV files.
When importing files from Excel, CSV or TSV files a new wizard dialog box will allow you to select variables, rename them, import variable description, and perform batch data type conversions This gives you greater flexibility to set up your analysis, make it more precise and start it more quickly, saving time and resources.
7. Deviation Table
The CODING BY VARIABLES feature now offers the possibility to produce a deviation table that allows one to obtain a list of codes most or least characteristic of different values of an independent variable as compared to other classes of this variable.

8. Export Results to Tableau Software
One can now export results to Tableau Software allowing one to use its advanced interactive data visualization tools. This feature is available from the CODING FREQUENCY and the CODING BY VARIABLES dialog boxes.

9. Numerical Transformation
A new numerical transformation dialog box allows you to compute numerical variables from other variables with up to 50 transformation functions including trigonometric, statistical, random number functions. Conditional transformation can also be performed using an IF-THEN-ELSE logical structure.

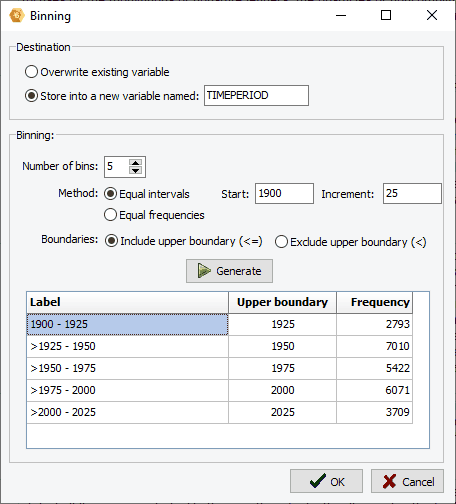
10. Binning
A binning feature can now be used to transform continuous values into a smaller number of distinct categories. It may be used to reduce the effect of numerical outliers, abnormal distributions, or convert a continuous numerical variable into an ordinal one. It is especially useful for creating graphic displays of comparisons when the number of distinct values in the numerical variable is too high.
11. Support of Missing Values
You can now associate to numerical, categorical, and short string variables up to three values that will be treated as missing data.
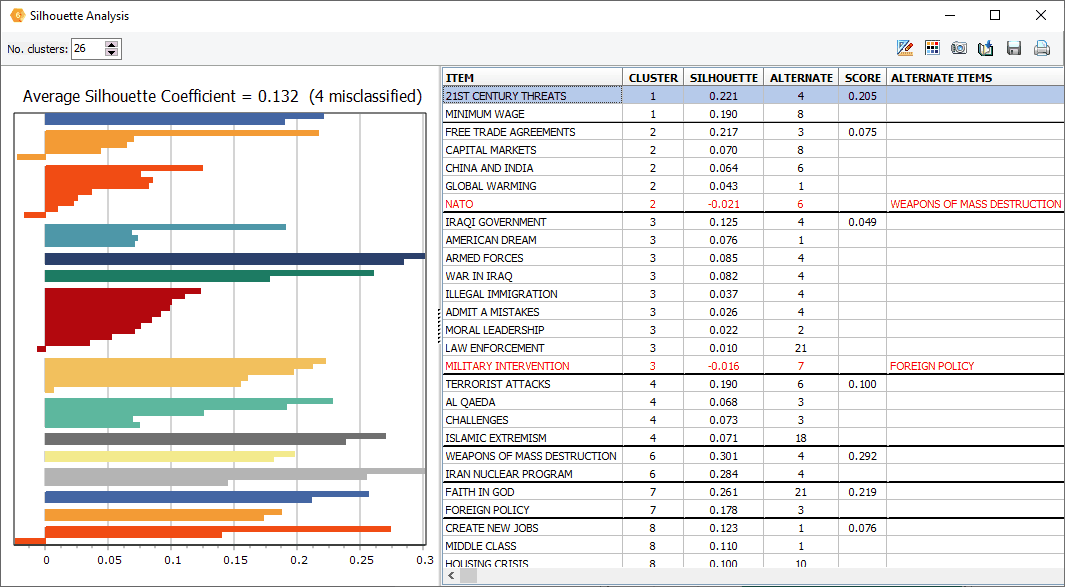
12. Silhouette plot
A new silhouette plot feature has been added to the hierarchical cluster analysis, allowing one to assess the quality of the cluster solution and identify potential misclassified items.
13. Date transformation
Date and date and time variables can now be used to create other categorical or numerical variables such as months, days or weekdays, months, years, etc.
![]()
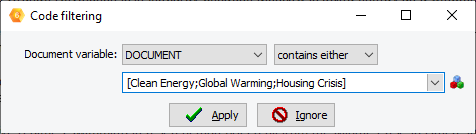
14. Improved code filtering feature.
The code filtering feature may now be used to filter cases based on the presence, the absence of specific codes or combinations of codes.
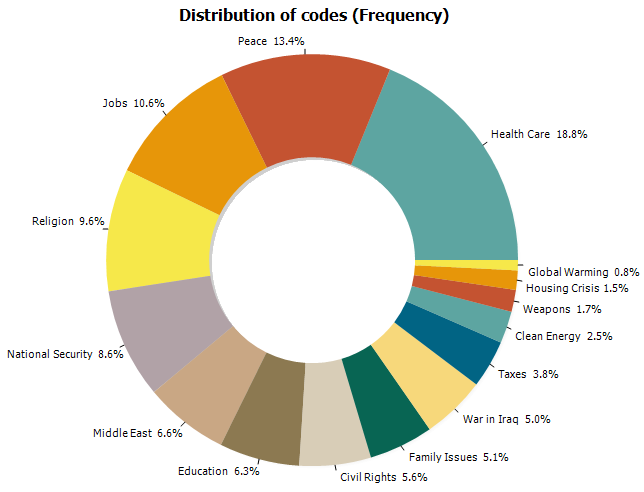
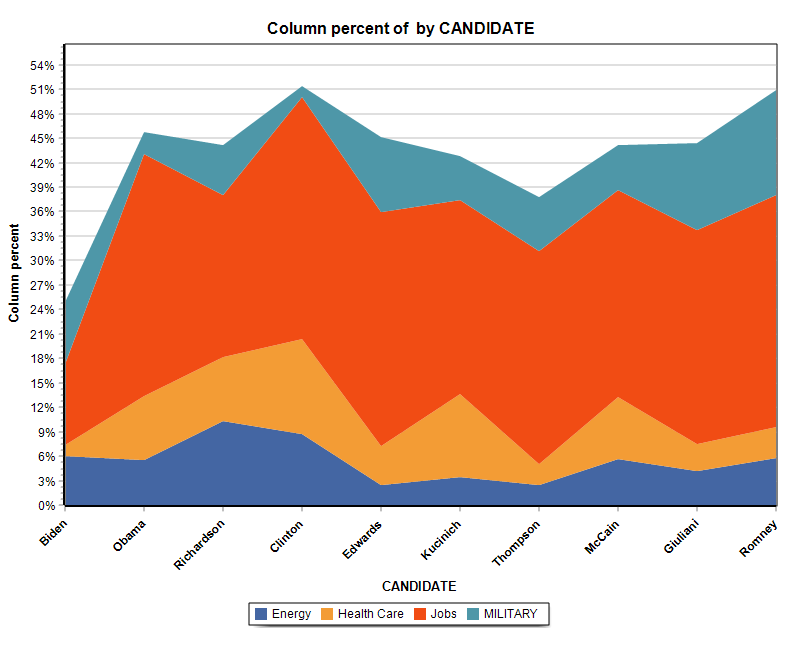
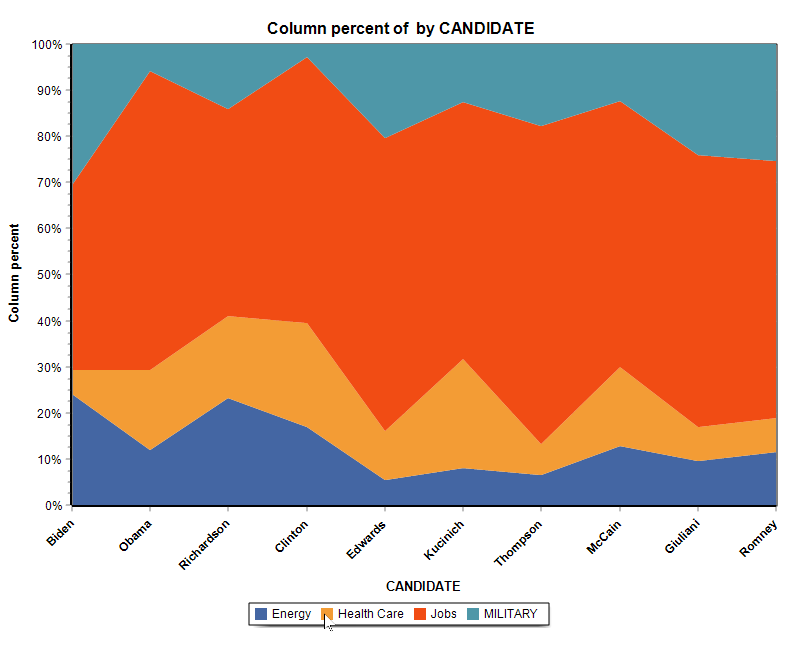
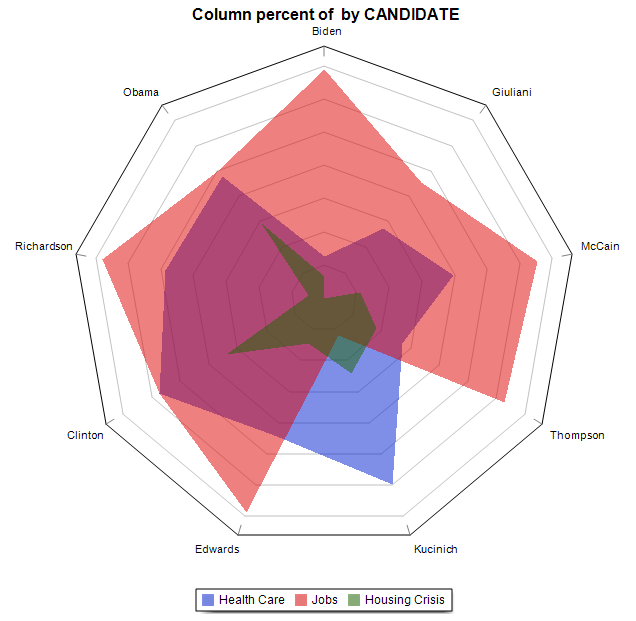
15. Donut, Radar, 100% Stacked Bar and Area Charts.
A donut chart can now be used to display relative codes or class frequencies (CODING FREQUENCY and VARIABLE STATISTICS dialog boxes). The charting feature of the CODING BY VARIABLES dialog box also adds the possibility to create a radar chart, a 100% stacked bar chart as well as two types of stacked area charts.
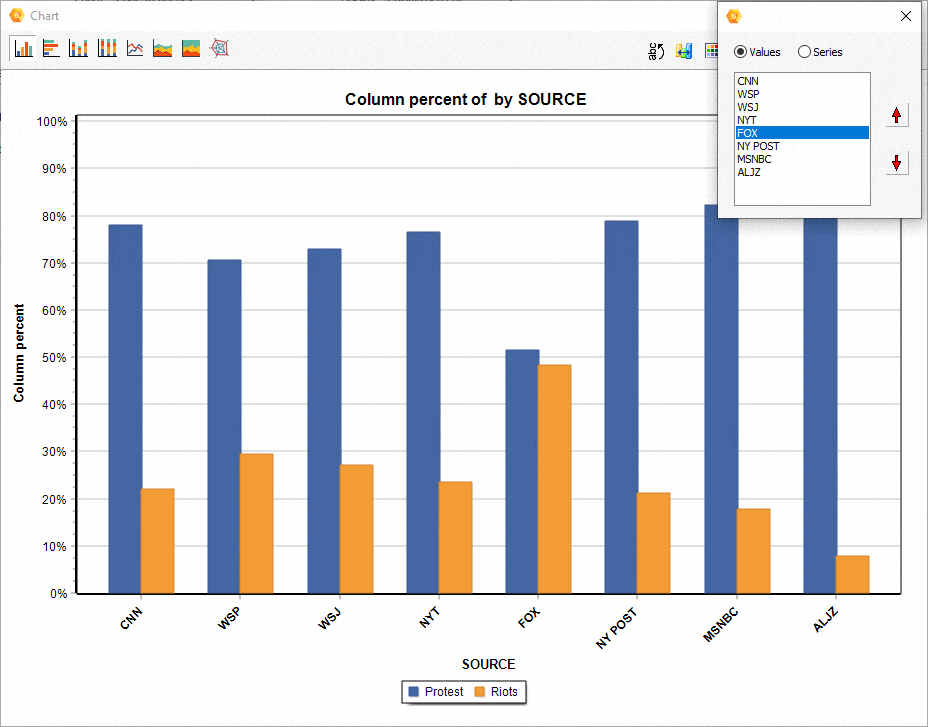
16. Ordering of series in comparison charts.
The relative position of a series of comparisons charts created from the CODING BY VARIABLES dialog box may now be manually adjusted, allowing you to achieve more appealing or revealing visualizations.
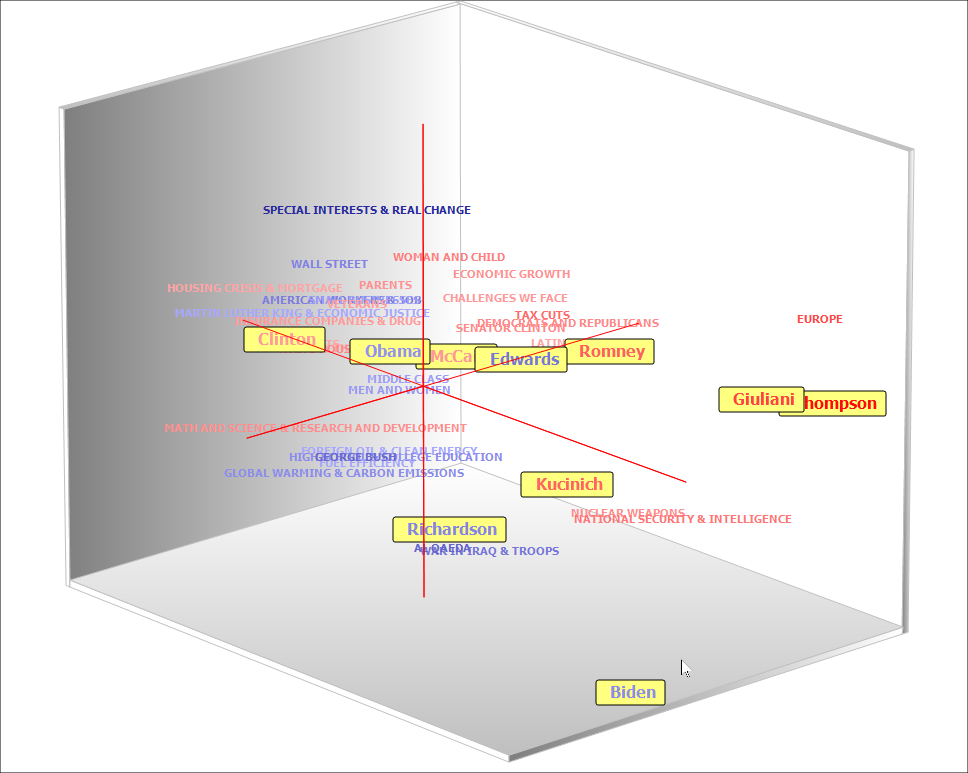
17. Color Coding of items in Correspondence Plot
Color gradients may now be used to represent the position of specific words or variable classes on the third (depth) dimension or 2D as well as 3D correspondence plot. Up to four colors may be chosen to create those gradients.
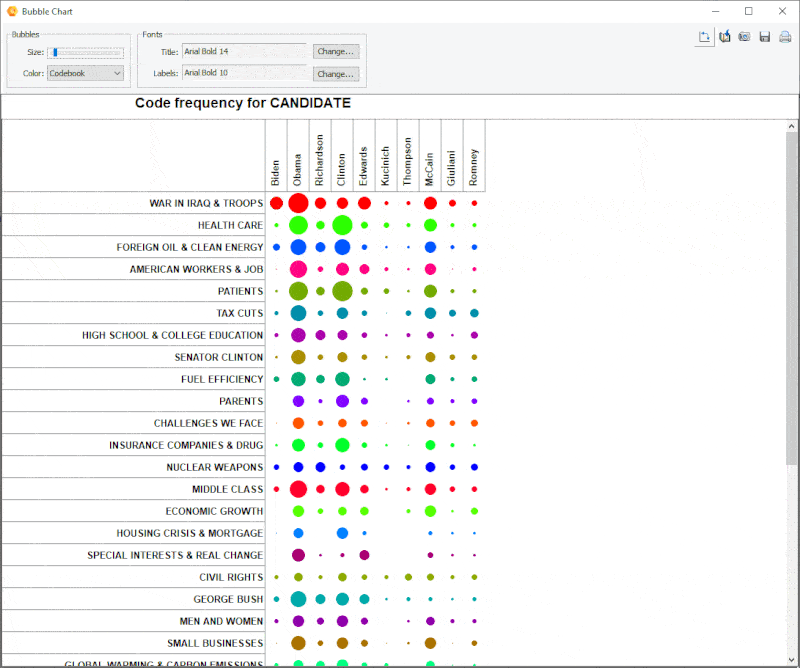
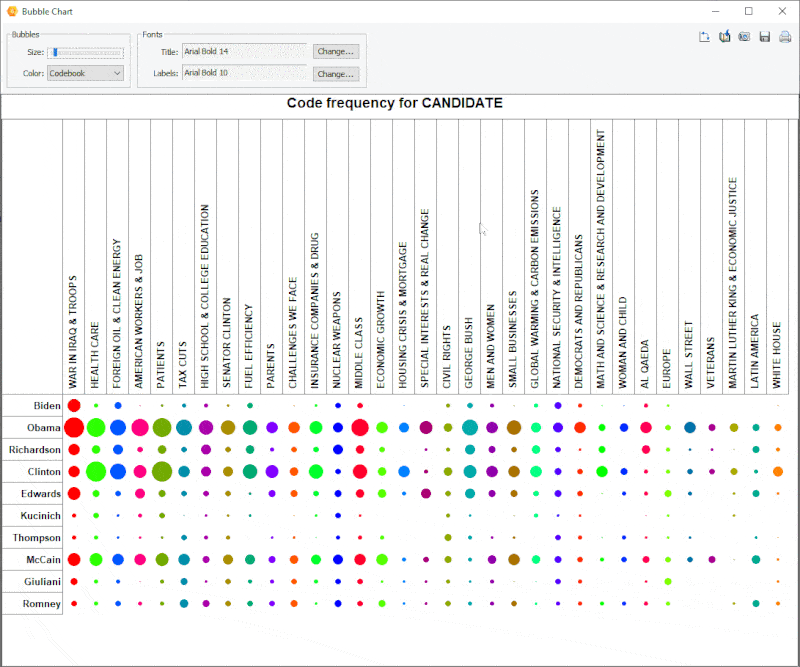
18. Improved Bubble Chart
It is now possible to transpose rows and columns of bubble charts and finely adjust the size of the bubbles.
19. Link Analysis Buffer
A link analysis buffer allows one to move back to previous link diagrams and then forward.
20. New Table Format and Table Editor
A new proprietary table format (*.pgrd) has been added to the exportation of tables to disk, allowing one to easily edit and annotate tables produced by QDA Miner. A free standalone table viewer may also be downloaded from our web site, allowing anyone to view, edit and annotate saved tables.
21. Numerous Additional Improvements
Several new options and interface improvements have been made to existing dialog boxes (code color selection, graphic options, etc.), management and analysis features.
Who uses QDA Miner?
QDA Miner qualitative data analysis software can be used by anyone who needs to code text or pictures, annotate, search, explore and extract information from small or large collections of documents and images, including:
- Researchers in social sciences, medicine, and psychology
- Sociologists, political scientists and ethnographers
- Business intelligence analysts, market researchers, pollsters, and CRM professionals
- Crime analysts, fraud detection experts, lawyers, and paralegal professionals
- Journalists, historians and research assistants
- Document management specialists and librarians

AI powering QDA Miner 2026
What’s New in QDA Miner 2026 This version introduces several groundbreaking features tailored for modern research workflows: Offline AI Transcription: Enjoy free, unlimited audio and video transcription that runs entirely on your local machine. Because no data is uploaded to the cloud, your… Read More »AI powering QDA Miner 2026

NOU! WordStat 2022 is here
WHAT’S NEW IN WORDSTAT 2022 Highly optimized topic modeling with factor analysis New multithreaded factor analysis routine is up to 65 times faster than prior versions. It means that large problems that would have taken an hour to compute can now be obtained in less than a minute. We were also able to increase the… Read More »NOU! WordStat 2022 is here

NOU! A aparut QDA Miner 6
WHAT’S NEW IN VERSION 6.0 1. New Grid view mode for coding short responses 2. Quotation Matrices 3. Enhanced annotation feature 4. Word Frequency Analysis and Word Cloud 5. Importation of Nexis UNI and Factiva Files 6. Improved Importation of Excel, CSV and TSV files. 7. Deviation Table 8. Export Results to Tableau Software 9.… Read More »NOU! A aparut QDA Miner 6

A fost lansat noul site Provalis Research ”Text Analytics for Everyone”
Compania Provalis Research, prodcatorul de software pentru analiza de text si date WordStat si QDA Miner, are un nou site, adaptat unei utilizari mai usoare si dedicat sectiunilor destinate intelegerii analizei text si aplicabilitatii acesteia: Resurse de studiu AICI

WS8 – New Deviation Table
WordStat 8 New Deviation Table Instantly Compares Words/Phrases Used by Different Variables We have introduced a special new feature to WordStat 8. This is a brand new feature that we believe you will find quite useful. We are calling it the Deviation Table. It allows you to see which words, phrases or topics are used… Read More »WS8 – New Deviation Table
CONNECT TO TEXT ANALYTICS – Nov2018 Free Webinar
Webinar on WordStat 8 New Features Marti 27 noiembrie 2018, Ora: 7 PM (East European Time) To help you better understand and locate the new features and capabilities of WordStat 8, we will be holding a FREE webinar. Please go to our website and register for the webinar: Webinar Registration. The webinar will last about… Read More »CONNECT TO TEXT ANALYTICS – Nov2018 Free Webinar

NOU! A aparut WordStat8 de la ProvalisResearch!
NOU! A aparut WordStat8! WordStat 8 – flexibilitate crescuta, performante si precizie imbunatatite, extinderea gamei de utilizare. Acces la tehnici avansate de analiza a textului, atat pentru novici cat si pentru experti. De acum WordStat ruleaza atat ca program de sine statator, cat si ca instrument apelabil din aplicatiile de textmining si analiza statistica QDA… Read More »NOU! A aparut WordStat8 de la ProvalisResearch!

WORKSHOP FOR QDA MINER AND WORDSTAT IN AUGUST 2017
Provalis Research is holding a three-day training workshop for QDA Miner 5 and WordStat 7 in Montreal, Quebec, Canada. The training will be held from August 16th to August 18, 2017 at the Provalis Research head office: 1255 Robert Bourassa Street, Suite 1604, Montreal, QC H3B 3X3, Canada. Read more

NOU: QDA Miner 5 de la Provalis Research
A apărut vrsiunea 5 a puternicului soft de analiză calitativă și data/text-mining QDA Miner. CE ESTE NOU? Version 5.0 gives you new ways to access and analyze unstructured data. You can easily import web surveys, social media, email providers and reference management tools. The new GIS mapping tool allows you to relate geographic information in… Read More »NOU: QDA Miner 5 de la Provalis Research